As was already
suggested in the DNA Science section,
the issue of choosing a reporter to measure the level of gene
expression and characterization of genetic circuits is not
trivial. If what we are measuring is related to the processes
of regulation
before translation the information we obtain from any experiment
should be independent of the particular reporter we are
using.
To address this issue
we measured the activity of the GFP genes in
three different ways: at the bulk, single
cell and mRNA level. All of these
were done on E. coli carrying a tetracycline inducible plasmid
controlling the GFP
gene (pZE21-GFP). As a result
all three measurments can be plotted simultaneously.
Future editions of
this project will also include measuring the activity of a
reporter enzyme, beta-galactosidase
(LacZ),
in bulk.
Bulk
GFP Measurement
Cells containing
a plasmid with GFP under the control of a tetracycline
inducible promoter were grown at different concentrations
of inducer (ATC) and their OD600 and GFP fluorescence
monitored as a function of time. The plate reader
allowed us to shake the cell cultures between reads and
control the temperature, thus the cells were grown directly
in the reader.
This type of
measurement gives us not only the end-point (steady state)
fluorescence, it also gives us information about the
kinetics of induction. |
 |
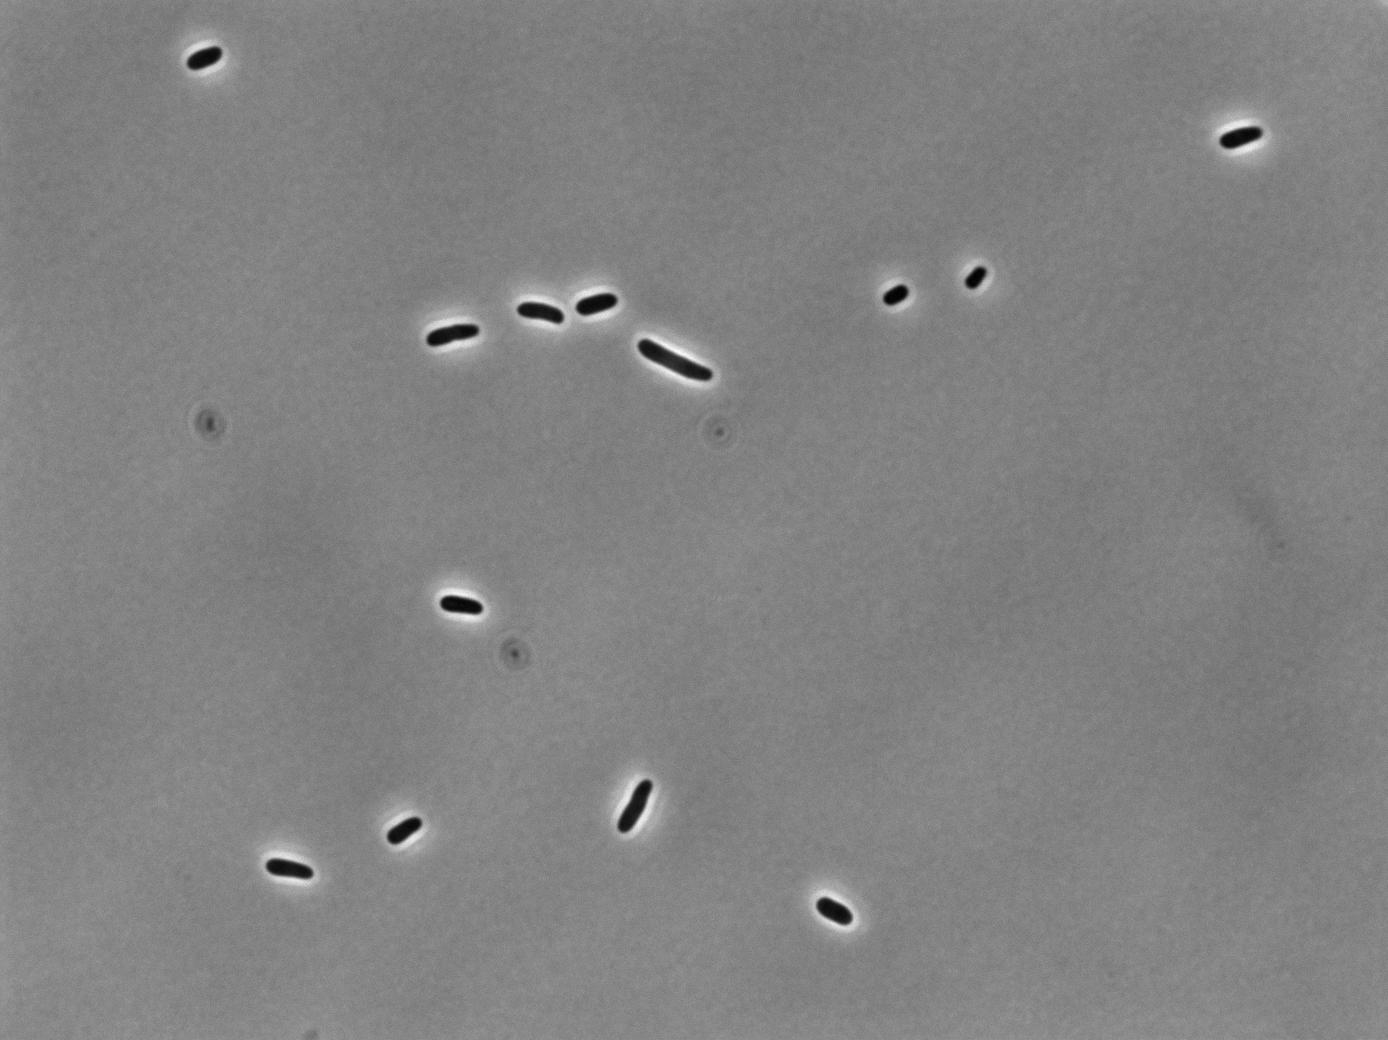
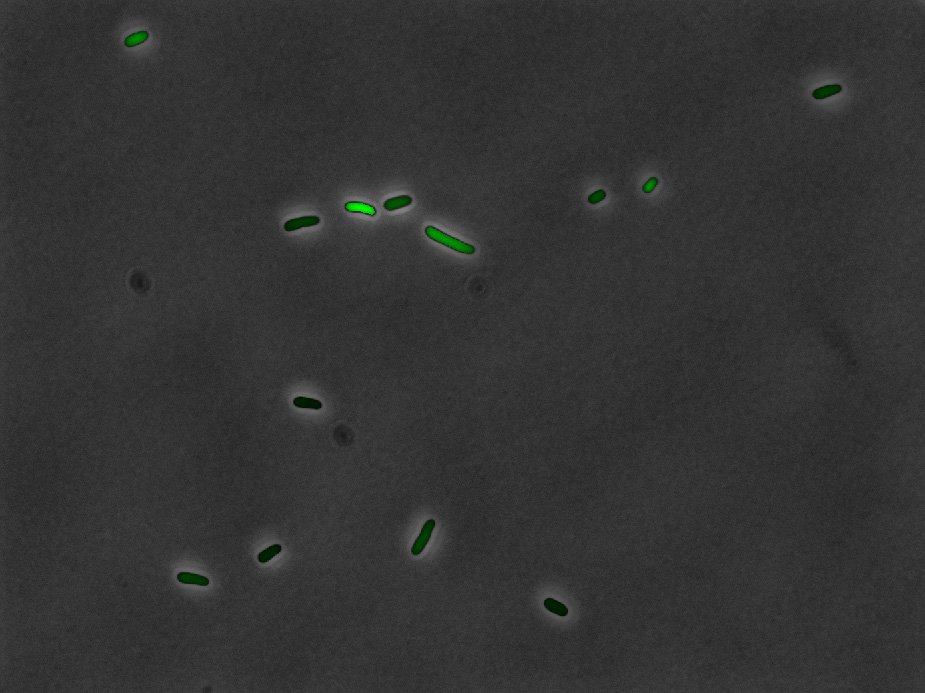
Single Cell GFP Measurement
The fluorescense of
E. coli the as
a function of the concentration of tetracycline. The approach
was to take phase contrast and fluorescence images of the same
field of view. The students wrote custom Matlab which allowed
them to recognize the cells in the phase contrast image and
then integrate the GFP fluorescence over the area of each cell.
Phase Contrast
|
Fluorescence

|
Individual
cells recognized by our Matlab code

|
Overlay of
fluorescence with the recognized cells
|
With this tool we
can now obtain single cell statistics such as the average fluorescence
per cell as a function of the concentration of inducer (ATC).
Measuring
the GFP mRNA concentration
 |
Using
GFP mRNA specific probes we performed a Taqman assay
of cells grown
in different concentrations of inducer, giving a fluorescent
signal proportional to the amount of amplified DNA.
Depending on the
average concentration of GFP mRNA per cell in each culture
there will be a different cycle number at which the signal
becomes detectable. In this fashion relative levels of mRNA
can be obtained. |
Preliminary comparison between the three measurements
From
the previous graph it can be seen that, even though the induction
curves seem to follow a similar trend,
the relative changes in gene-expression are different. This is
nowhere near conclusive, but it is a good start especially
taking into account that these are the first experiments regarding
gene expression performed by most of the students and that
these three different assays were all done in only two days.