

The enzyme
beta-galactosidase (drawing by David Goodsell)
In a classic
assay, students validate the use of linear kinetic theory using
the enzymatic activity of beta-galactosidase. In E. coli this
enzyme is responsible for breaking lactose down into glucose
and galactose, which are two more readily usable forms of energy
for the cell. However in our case, we allow the enzyme to work
on the lactose analog ONPG. The enzyme breaks this down into
galactose and the molecule ONP. ONP having a
well characterized absorbance at 420nm is used to track the
rate of the enzymatic reaction. The chemical reaction is given
by: 
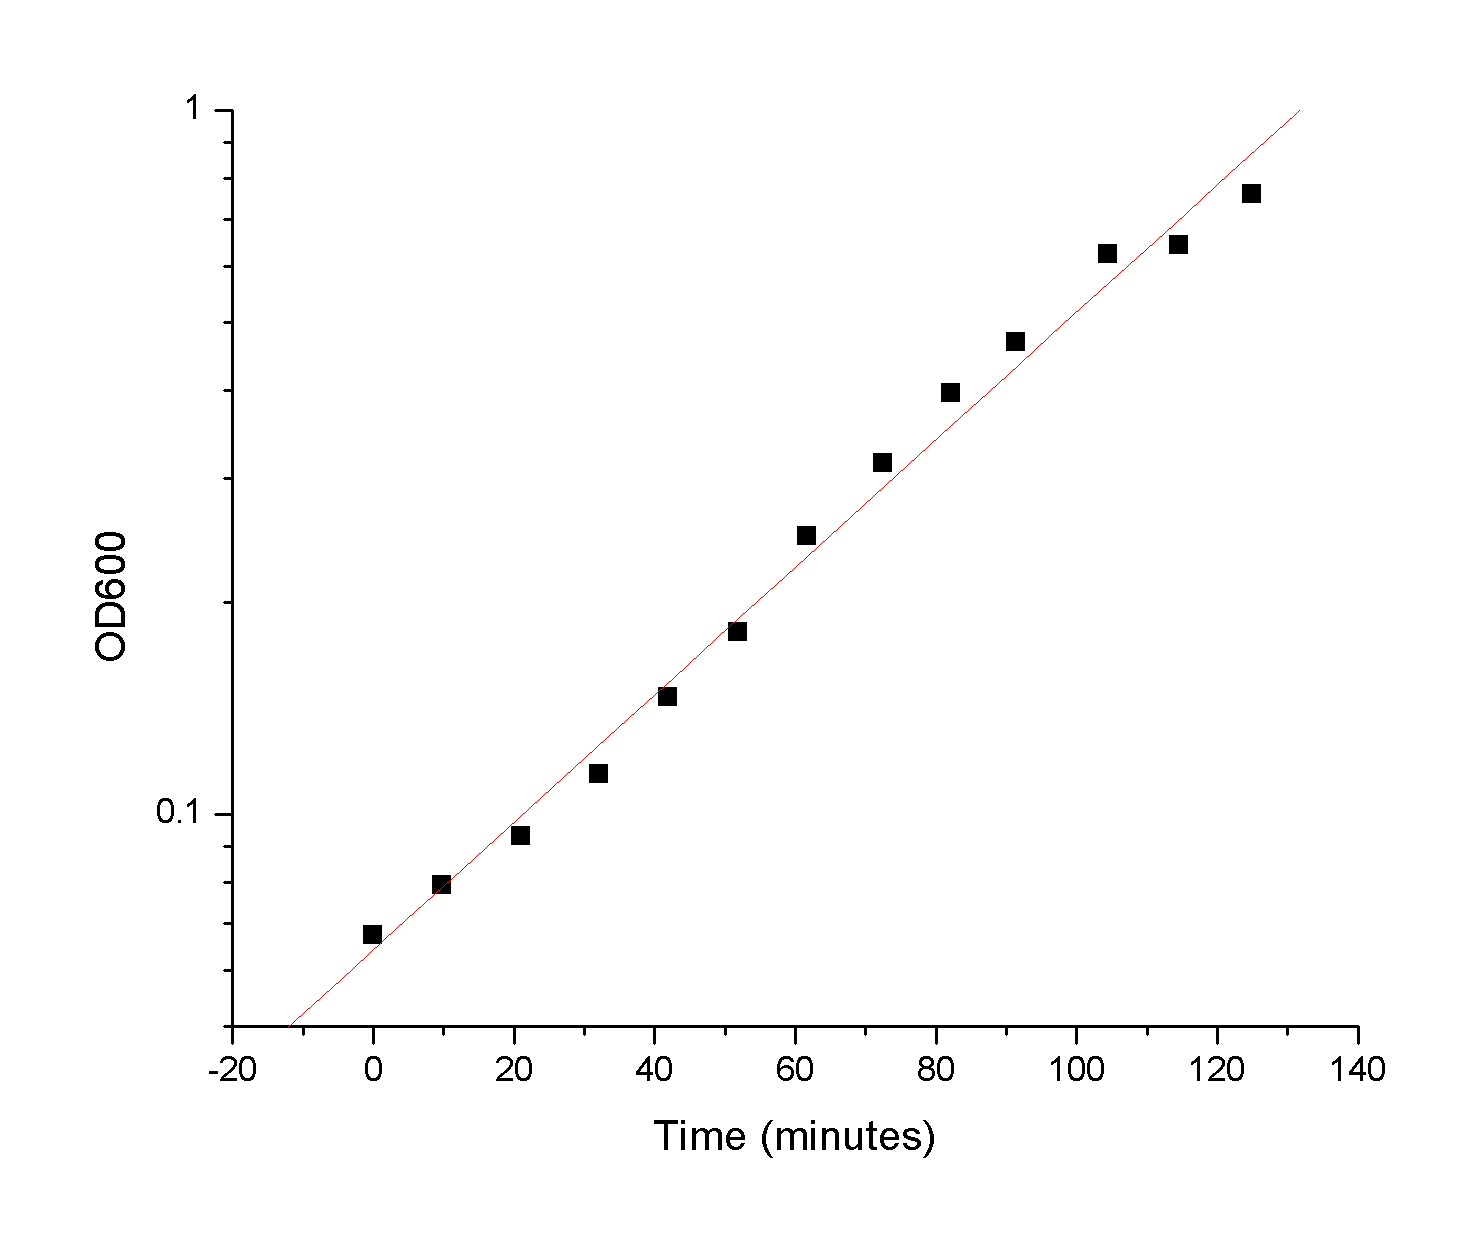
Using
kinetic spectrophometry they measure the production of ONP as
a function of time for
varying concentrations oaf the enzyme. This allows them to deduce
activity of the enzyme and in some sense validate their understanding
of linear kinetic theory. At early times in the reactions the concentration
of ONP should be given by:

The students
logarithmically sampled the kinetics by varying the beta-gal
concentration:

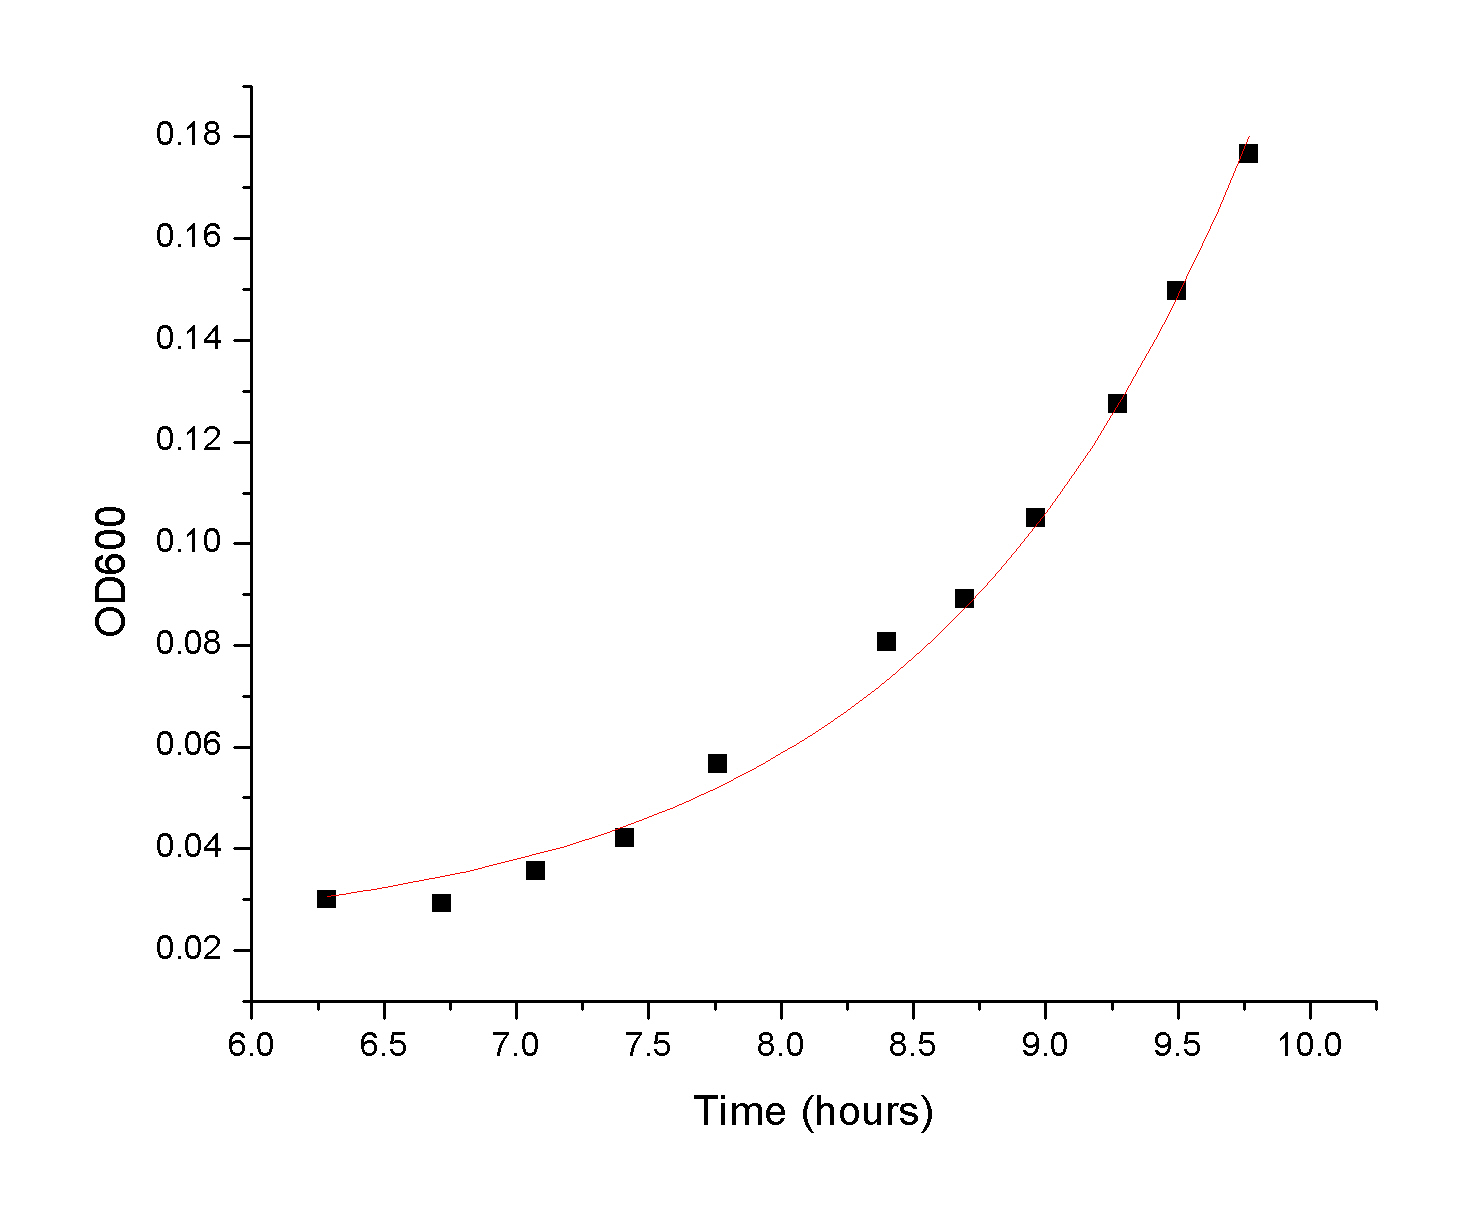
Once the raw kinetic
data is collected, the students have an average rate for a given
enzyme concentration. This allows to obtain the forward rate of the reaction:

|


