The primers were chosen so that we had sticky ends for the ligation.
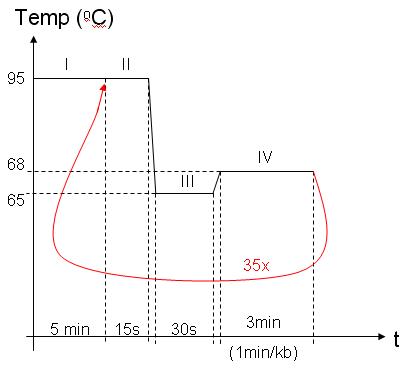
I – DNAP activation (it comes bound with antibody)
II – Melting: dissociate DNA double helix
III – Annealing: primers adhere to DNA
IV – Elongation: DNAP copies DNA |
3) Store at -20 oC.
{top}
Gel Electrophoresis
We need at least 150ng from our samples, loading dye (1:6) and DNA ladders of known length.
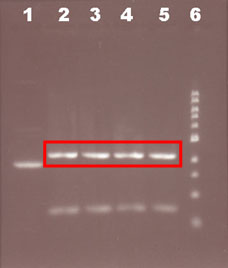
13 lanes were used. The following numeration goes from left to right (the wells are on the top):
Lane |
Sample |
Amount |
Results & Comments |
1 |
Water with dye |
|
learning how to load |
2 |
Water with dye |
|
learning how to load |
3 |
Water with dye |
|
learning how to load |
4 |
E. coli PCR |
5ul + 1ul dye |
Unexpected. The PCR might not work. |
5 |
Plasmid PCR |
5ul + 1ul dye |
One band ~3kb (3075 LacZ) |
6 |
Lambda/HindIII (500 ng/ul) |
1.5ul + 3.5ul H2O + 1ul dye |
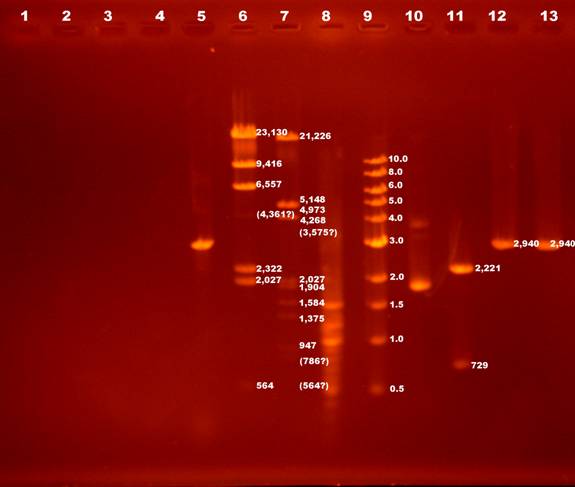
7 bands shown. 125bp fragment is not there. Maybe run out of gel or too weak. The 4,361bp fragment is much weaker than expected. |
7 |
Lambda/HindIII + EcoRI (30 ng/ul) |
5ul + 1ul dye |
5 cuts by EcoRI.
Fragment of 23,130bp becomes 21,226bp and 1,904bp.
Fragment of 9,416bp becomes 5,148bp and 4,268bp.
Fragment of 6,557bp becomes 4,973bp and 1,584bp.
Fragment of 4,361bp becomes 3,575bp and 786bp.
Fragment of 2,322bp becomes 1,375bp and 947bp. |
8 |
100 bp ladder (500 ng/ul) |
1.5ul + 3.5ul H2O + 1ul dye |
unexpected |
9 |
1kbp ladder (500 ng/ul) |
1.5ul + 3.5ul H2O + 1ul dye |
Exact fragments as from neb.com. |
10 |
Uncut vector |
5ul + 1ul dye |
Super coiled structure. So appeared as shorter length. |
11 |
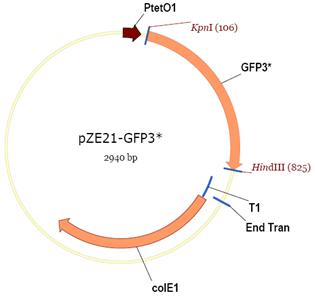
Vector + HindIII + KpnI (28 ng/ul) |
5.5ul vector + 1.1ul dye |
Double cut the plasmid to 2221bp and 729bp. |
12 |
Vector + HindIII (6.8 ng/ul) |
16.7ul vector + 3.3ul dye |
Single cut. 2940bp. |
13 |
Vector + KpnI (6.8 ng/ul) |
16.7ul vector + 3.3ul dye |
Single cut. 2940bp |
After loading everything, run 1% TAE gel at 100V for 80 minutes
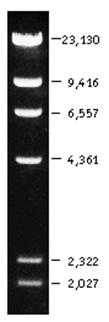
100bp DNA Ladder (neb.com) 1kb DNA Ladder (neb.com) LambdaDNA HindIII digest (neb.com)
Below is a illustration showing the relationship between lambda-HindIII and lambda-HindIII/EcoRI digestion. All the fragments are as expected except that the 4,361 fragment seems to be missing from beginning lambda-HindIII digestion. The yellow arrows show the fragments cut by EcoRI. The green arrow shows the fragment uncut by EcoRI. The blue arrow shows the suspect position of the 4,361 fragment before and after cut by EcoRI.
{top}
Prepare Vector Cut
1) Cut vector pZE21-GFP with HindIII and KpnI
2) Run gel electrophoresis.
3) Extract the cut vector from the gel:
Observation: As a control, we should run next to the cut vector the uncut sample and the DNA ladder.
4) Purify the PCR product using the QIAquick PCR Purification Kit
This step is necessary in order to purify the DNA (obviously) by removing impurities such as agarose (the gel), ethidium bromide (agent used to visualize the DNA), primers etc. The protocol:
Add 5 volumes of Buffer PB to 1 volume of the PCR sample and mix
Place a QIAquick spin column in a provided 2 ml collection tube
Appply the sample to the QIAquick column and centrifuge for 30-60s, to bind DNA
Discard flow-through and place the QIAquick column back into the same tube
To wash, add 0.75 ml Buffer PE to the QIAquick column and centrifuge for 30-60s
Discard the flow-through and place the QIAquick column back in the same tube. Centrifuge the column for 1 min
{top}
Ligate the vector to the lacZ insert, using ligase, in order to get a new plasmid.
The used protocol was from Roche's Rapid DNA Ligation Kit. According to it, the maximum amount of DNA should not exceed 200 ng.
The insert (3075bp) was at 17.8ng/ul, and the vector (2223bp) was at 31ng/ul. We did different insert:vector molar ratios. For 1:1, what should be the volume from each one?
Mass (vector ) = Mass (insert) * 2223/3075
=> V (vector) = Mass (insert) * (2223/3075) * (1 / 31)
Let's choose: Mass (insert) = 50ng => V (insert) = 2.8ul, and V (vector) = 1.2ul
Therefore, we used the following values:
Ratio |
insert |
vector |
DNA Dilution Buffer |
1:3 |
2.8ul |
3.6ul |
3.6ul |
1:1 |
2.8ul |
1.2ul |
6.0ul |
3:1 |
2.8ul |
0.4ul |
6.8ul |
No insert |
- |
1.2ul |
8.8ul |
No vector |
2.8ul |
- |
7.2ul |
To set up the ligation reaction, we add 10 μ l of insert DNA and vector mix, 10 μ l of ligation buffer and 1 μ l of T4 ligase.
After ligation, the desired construct should look like:
Do the PCR purification and the killer cut to get rid of possible religation
{top}
Electroporation to do the transformation
We should transform no more than 20ng of ligation, using all the ligations and the original plasmid.
So we added 2 μ l of ligation reaction solution to competent cells. Also set up transformations of killer cut to eliminate the effects of relegation and compare without killer cut. “ Killer cut ” is a restriction digest of the ligation mix using a restriction enzyme that cuts within the starting vector but does not cut the ligated product. This will select against non-recombinants . The rationale for killer cuts is that any contamination with religated starting vector or intact starting vector will be linearized and thus will transform bacteria much less efficiently than the circular intermolecular ligation product.
Transformation efficiency can be calculated as number of colony forming units (cfu) divided by the corresponding mass of transformation DNA used for plating.
Without killer cut |
Insert vector ratio |
Colony count (cfu) |
Transformation efficiency (cfu / ng DNA)
|
1:3 |
~2500 blue, 128 white |
~1.3x10^3 |
1:1 |
(no plate) |
- |
3:1 |
526 blue, 26 white |
8.2x10^2 |
No insert |
18 white |
40 |
No vector |
14 blue |
28 |
Vector (pZE21-GFP) |
Too many white to count on 2 plates |
- |
With killer cut |
Insert vector ratio |
Colony count (cfu) |
Transformation efficiency (cfu / ng DNA)
|
1:3 |
28 blue, 69 white |
53 |
1:1 |
5 blue, 43 white |
50 |
3:1 |
3 blue, 12 white |
23 |
No insert |
1 white |
2 |
No vector |
No colonies found |
0 |
Vector (pZE21-GFP) |
1 st plate: 22 large white with lots of small white. 2 nd plate: no colonies
|
0 |
The results of transformation without killer cut are reasonable. The blue colonies are what we want with lacZ gene. The transformation efficiencies are in the right range. Negative controls of no insert and no vector shows the false positive results are about two orders lower. The results with killer cut are weird. We would expect for similar transformation efficiency and lower false positives. It seems the enzyme used in killer cut can also cut the cloned plasmid.
{top}
Measuring gene expression
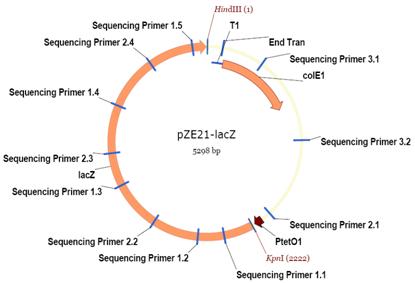
To measure the gene expression, we transformed E. Coli MC4100Z1 cells with plasmid pZE21-GFP. pZE21-GFP contained a ColE1 origin, kanamycin resistance cassette, P LtetO1 promoter, and gfpmut3. W e plate d the transformed cells on agarose gel with X-gal (an analog of beta-gal and substrate for ß-galactosidase ), kanamycin and the ATC (tetracycline) inducer.
If the bacterial cell really contains the plasmid that we inserted, we will be able to see blue dots on the plate, because the cells will express the gene for beta-galactosidase (since they are in the presence of ATC ) and will cleave the X-gal . The kanamycin is used to kill all the cells that didn't incorporate the vector. The GFP gene should be expressed too, so we expect to see fluorescent cells.
To measure the fold-change, using the GFP fluorescence, we have to do some calibration, because the fluoresce that we observe now may be due to the media and the cell themselves. See topic below.
We could also vary the content of the plates:
- When we are interested in the lacZ gene, the plate must contain X-gal and ATC, so that our gene of interest is activated. Then we can plate cells with X-gal, but with or without kanamycin.
- In the plates without the antibiotic, we don't expect to see gene expression, because the wild type of E. coli probably will be dominant. So we won't be able to see fluorescent cells.
- In the plates with kanamycin, we should see blue dots and fluoresce, as discussed above.
- We can also plate cells without ATC, but with the antibiotic, to calibrate the gene expression measurement. This way we can measure if there is any inherent fluoresce in the cells and/or in the media. Let's call this intrinsic fluorescence GFPauto. The fold-change becomes
Now we have a value of fold-change as a function of [ATC], which is our gene expression measurement.
Procedure
- Grow up eight tubes E. Coli overnight.
- MC4100Z1: negative control. No lacZYA, but has lacI, tetR and araC.
- MC4100-pZE21GFP: positive control. MC4100 has no lacZYA, lacI, tetR and araC. GFP is expressed without repression.
- MC4100Z1-pZE21LacI: better negative control. The plasmid has ~50 copeis, which is similar to pZE21GFP and can count for possible auto fluorescence.
- MC4100Z1-pZE21GFP, 0ng/ml ATC.
- MC4100Z1-pZE21GFP, 1ng/ml ATC.
- MC4100Z1-pZE21GFP, 5ng/ml ATC.
- MC4100Z1-pZE21GFP, 10ng/ml ATC.
- MC4100Z1-pZE21GFP, 50ng/ml ATC.
- Dilute with 1:100 minimal media and continue to grow for a couple of hours. This will reduce auto fluorescence to minimal level.
- Make some agar slides.
- Heat up 1.5% low melting temperature agar.
- Put 2.5ml on thing 25mm by 60mm cover slide. Put on another cover slide before it cools down.
- Cut to small pieces for use.
- Put 2 μ l of cell culture onto agar piece, which is sandwiched between one 25mm by 60mm standard slide and one 25mm by 30mm thing cover slide.
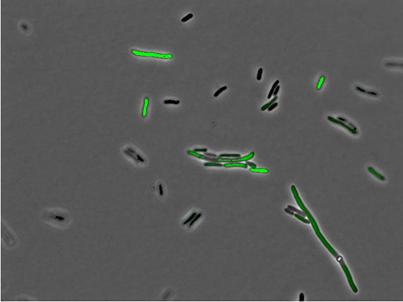
- Take both bright field phase contrast image and green fluorescent image.
Data processing
Unfortunately, there are some problems when we saved the images. The camera took 12 bit images, but they are saved to 8 bit images by default. And the images are not scaled from 12 bits to 8 bits, but truncated. So we borrowed images from Alex, Eileen and Jin-Hong.
For each sample, we took five groups of images. In each group, there is one phase contrast image and one fluorescent image. We use matlab to process the images. Start from initial phase contrast image
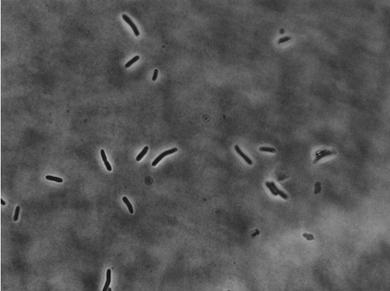
To get an initial mask, threshold operation is applied to the phase contrast image.
Also a size histogram can be obtained:
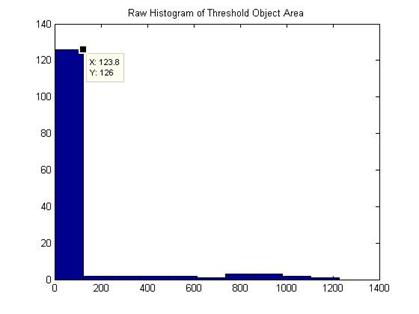
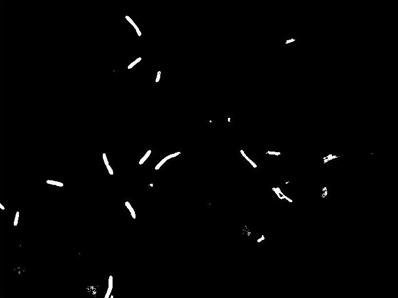
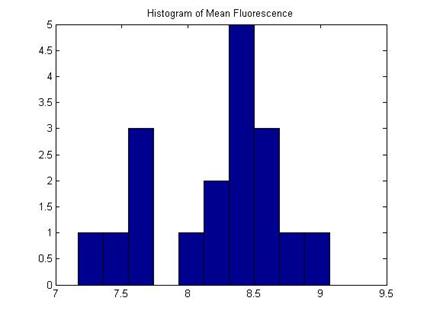
With the aid of the histogram, a size exclusion operation is performed to get rid of false cell identification of small areas. Thus a refined phase contrast mask is obtained. Next the refined mask is applied to the fluorescent image and a histogram of fluorescent intensity is obtained. We can calculate the mean cell fluorescent intensity at this point.
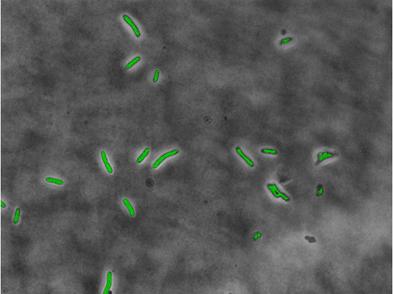
Here is an overlaid fluorescent image after the masking operation to the original phase contrast image. The fluorescent image has been scaled so that it can be visualized easily.
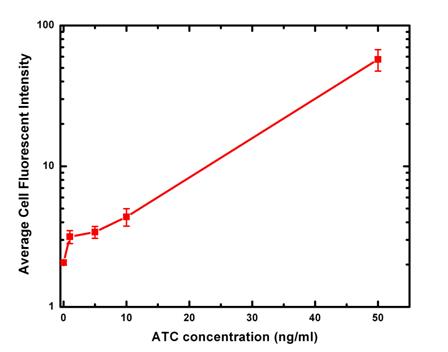
Here is a table and a plot summarize our measured fluorescent intensity data.
|
MC4100Z1 |
MC4100Z1-pZE21-LacI |
MC4100Z1-pZE21-GFP |
0ng/ml ATC |
1ng/ml ATC |
5ng/ml ATC |
10ng/ml ATC |
50ng/ml ATC |
1 |
1.636 |
1.0178 |
1.9293 |
2.8341 |
2.8894 |
3.3404 |
53.7817 |
2 |
1.9924 |
1.1225 |
2.1246 |
2.8939 |
3.5479 |
4.264 |
56.1307 |
3 |
1.9274 |
1.3524 |
2.1167 |
3.1111 |
3.7599 |
4.8958 |
43.2258 |
4 |
1.9131 |
1.2084 |
2.0732 |
3.6537 |
3.3274 |
4.7651 |
65.6225 |
5 |
1.9613 |
1.0807 |
2.0892 |
3.2831 |
3.4911 |
4.5908 |
68.1243 |
Average |
1.88604 |
1.15636 |
2.0666 |
3.15518 |
3.40314 |
4.37122 |
57.377 |
Std |
0.14313 |
0.12962 |
0.0795 |
0.33098 |
0.3262 |
0.62302 |
9.97783 |
Unfortunately, all the images except one of the positive control, MC4100-pZE-GFP, also have the problem of saving as 8 bit images. For the only one set of images that were saved as 16 bits, we measured the average cell intensity to be 22.5705.
For fluorescent images of 50 ng/ml ATC induction, there is only a fraction of cells fluorescent strongly (as below), so the variation is relatively large. This variation may come from DNA or protein level. The number of plasmids each cell took in transformation is different. Depending on cell cycle, their protein expression level might also be different. Finally there are some cells out of focusing planes, so their fluorescent signals are expected to be weaker.
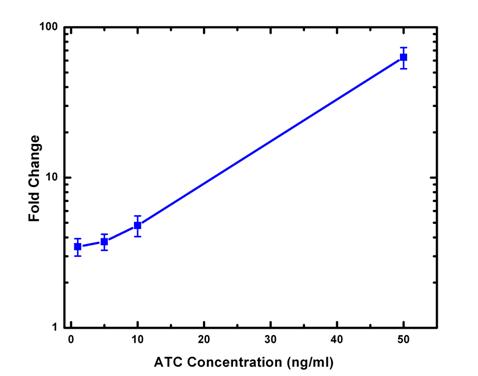
From the average cell intensity data, we can calculate the fold change and plot the data against inducer ATC concentration. From the data, we can see induction by ATC changes the expression of GFP exponentially. In the future experimentally design, it ’ s desirable to have at least one more data point of ATC concentration in 20-30ng/ml range.
{top}
Appendix
Some useful explanations:
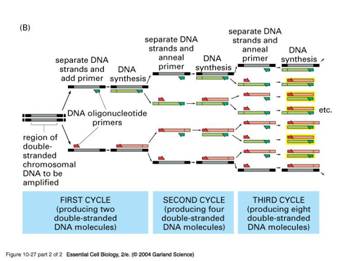
PCR (Ploymerase Chain Reaction) - amplify the amount of DNA (Xerox machine), but only the part that we want. What is used?
DNA template – contains regions of the DNA to be amplified;
2 primers – they are short artificial DNA strands that determine the beginning and end of the region to be amplified;
DNA Polymerase (DNAP) - an enzyme that can synthesize new DNA strands using a DNA template (it comes bound with antibody). We used the Taq polymerase, a heat-stable DNA polymerase isolated from the bacterium Therrnus aquaticus.
Nucleotides (dNTP) - material used by the DNAP to build the new DNA;
Buffer – provides suitable chemical environment, e.g. keeping the pH stable (DNA is an acid)
qPCR (Quantitative PCR) - is used to rapidly measure the quantity of PCR product (preferably real-time), thus is an indirect method for quantitatively measuring starting amounts of DNA, cDNA or RNA. This is commonly used for the purpose of determining whether a sequence is present or not, and if it is present the number of copies in the sample.
Restriction enzymes – catalyse the cleavage of DNA at very specific sites (scissors), performing the restriction digest or DNA fragmentation. These enzymes cut open a plasmid vector (vehicle for delivering genetic material to a cell) to insert a gene of interest. The plasmid must contain an origin of replication (a unique DNA sequence where DNA replication starts). EcoRI and HindIII are examples of restriction enzymes
Plasmids – circular double-stranded DNA molecules that are separate from the chromosomal DNA. In genetic engineering, they are called vectors. They often contain the ability to make the bacterium antibiotic resistant.
Ligases – enzymes that reform the chemical bonds from the DNA (undo the work of the restriction enzymes) – glue
Sticky end – Also known as cohesive end. It is one of the two possible configurations resulting from the breaking of double-stranded DNA. If one strand extends beyond the complementary region, then the DNA is said to possess an overhang. If another DNA fragment exists with a complementary overhang, then these two overhangs will tend to associate with each other and each strand is said to possess a sticky end:
5'-GACTATCT + GCGATGCTGTA-3'
3'-CTGATAGACGCTA CGACAT-5'
These two fragments can be bounded by the ligase.
Agarose gel electrophoresis – a method used to separate DNA strands by size and to determine the size of the separated strands by comparison to strands of known length. An electric field is used to push negatively charged DNA molecules through a gel matrix. DNA molecules that are shorter move faster than longer molecules, because of their smaller mass. Other factors that influence the rate of migration are the concentration of agarose, the conformation of DNA and the voltage.
To visualize the DNA in the gel, one uses ethidium bromide (EtBr), an agent that binds to DNA and, when exposed to ultraviolet light, fluoresces with a red-orange color. Because it binds to DNA, EtBr is a very strong mutagen, and may possibly be a carcinogen or teratogen.
Transformation – the genetic alteration of a cell resulting from the introduction, uptake and expression of foreign genetic material (DNA or RNA). This is one of the ways that bacteria exchange genetic material. They can transfer genetic material from one bacterium to another through the liquid in which the bacteria live.
DNA extraction – the process whereby DNA is purified from cells
Insert - a DNA sequence that is placed into a vector using recombinant genetic engineering techniques. Vectors are used to stabilize, transport, and express the DNA insert.
Electroporation – a process used to inject DNA into the cell, through the application of a short, high-voltage electric pulse to cells in the presence of DNA. Electroporation occurs as a result of the reorientation of lipid molecules of the bilayer membrane to form hydrophilic pores in the membrane. This process can be used for the transformation of bacteria, but, besides the lipid membrane, they have cell walls, which are made of cellulose and its derivatives. But these walls can be weakened by a process of freezing to make them “electrocompetent”. If these cells and plasmids are mixed together, the plasmid can be transferred into the cell using the electric pulse.
{top}