DNA
SCIENCE WEEK 1
Objectives:
Restriction Digest
and Electrophoresis
Introduction:
Plasmids are
typically circular double-stranded DNA molecules that replicate within a
cell independently of the chromosomal DNA. They are often used to
import recombinant DNA into a host cell for cloning. More
precisely, a DNA fragment that contains a gene of interest is inserted
into a cloning vector, or plasmid, and then it can be used to transform
a host cell. The cloning process involves the use of many
biological tools. A restriction enzyme recognizes and cuts DNA at a
particular sequence of nucleotides by hydrolyzing the phosphodiester
linkage. Polymerase Chain Reaction (PCR) enables to produce and
exponentially amplify a specific gene or gene fragment of interest with
appropriate primer design. For the visual analysis of the
restriction digest and PCR product, gel electrophoresis is often
employed to separate DNA fragments by their size.
In the overall
experiment, we would extract the lacZ gene from wild type E. Coli
(MG1655, GenBank U00096), insert it into a pZE21-GFP vector with
kanamycin resistance, and finally transform the E. Coli cell so that it
can express lacZ upon the induction of tetracycline promoter. As
the first series of this experiment, cloning vectors were obtained by
double digesting pZE21-GFP with KpnI and HindIII. lacZ gene from
wild type E.Coli (MG1655) was then amplified using PCR. The
results were analyzed via gel eletrophoresis.
Materials and Methods:
Restriction
Digest:
λ-phase DNA
predigest by HindIII was cut by EcoRI enzyme.
pZE21-GFP was digested by three different ways: single digestion by
HindIII, single digestion by KpnI, and double digestion by
KpnI and
HindIII respectively. For each restriction enzyme used, an
optimal buffer was chosen by consulting the
endonuclease catalog1. In case of double digestion,
a single buffer was used by referring to the table of
Suggested NEBuffers for Double Digestion at the catalog1.
Since the selected buffer from the double digest table would not ensure
100% activity of enzymes, higher concentration of vector was added to
the mixture. After selecting appropriate buffers for each sample,
reaction solution was prepared by mixing a DNA sample, selected buffer,
H2O, and restriction enzyme to desired DNA concentration into
a 1 ml centrifuge tube.
Then sample tubes were spun down to pull down all the liquids. In
order to facilitate digestion, tubes were placed in the 37°C bath for 2
hours. The reaction was stopped by placing the tube into the 65°C
bath for 5 minutes as this would effectively destroy the enzymes.
Polymerase Chain
Reaction:
The PCR mix was set
up in a 1 ml tube as follows: 0.5 μl of DNA template (MG-1655 and
pZE21-GFP), 0.5 μl of forward and reverse
primers ordered from IDT (200 nM final concentration of each), 0.4 μl of
H2O, and 22.5 μl of AccuPrimeTM pfx
SuperMix (Invitrogen). Samples were spun down to ensure all liquid
is at the bottom. PCR (Techne, TC-312) was carried out with initial
denaturation at 95°C for 5 min; 35 cycles of 95°C for 15 sec (melting),
65°C for 30 sec (annealing), and 68°C for 3 min (elongation) and a final
cooling step at 4°C.
Gel
Electrophoresis
First of all, the
agarose gel was heated in the microwave to fully liquefy. The lane
come was placed in the gel tray. Then the tray was filled with
liquefied gel up to 1/3 of its height, ensuring no bubble formation.
Once the gel is solidified, the comb was carefully removed, ensuring no
damage to the gel. 1X TAE buffer was poured into the reservoirs so
that the gel is submerged with approximately 1 mm depth.
The loading samples
were prepared by mixing the DNA fragments, water, and 6X loading dye
properly on the paraffin film so that the final amount of DNA becomes
around 150 ng. Also the loading volume did not exceed 20 μL as it
would result in over flooding in the lane. 100 bp and 1 Kbp
ladders were also loaded as molecular size markers. After all
sample were loaded, the gel was ran at 100 V for 80 minutes. The
gel was removed from the TAE buffer solution and placed in the Ehidium
Bromide staining bath for 10 minutes. Special caution in handling
Ethidium Bromide was required as it is a dangerous mutagen and
carcinogen. After the staining, the gel was transferred to the
water bath and rinsed for 20 minutes. Finally, the gel was placed
on the UV light stage and the result was taken as pictures by Sony DSC
F707 at wavelength of 302 nm for the
visual analysis of restriction digest and PCR products. The
digital image was further processed by MATLAB to ease the quantitative
analysis.
Results
The following DNA samples were loaded on the gel as described before.
|
Lane |
DNA sample |
Concentration (ng/ul) |
Volume of DNA sample loaded (ul) |
Total DNA amount loaded (ng) |
|
4 |
PCR product of E-Coli |
|
5 |
|
|
5 |
PCR product of plasmid |
|
5 |
|
|
6 |
λ-phase/HindIII |
500 |
1.5 |
750 |
|
7 |
λ-phase/HindIII + EcoRI |
30 |
5 |
150 |
|
8 |
100 bp ladder |
500 |
1.5 |
750 |
|
9 |
1 Kbp ladder |
500 |
1.5 |
750 |
|
10 |
Uncut Vector |
13.4 |
5 |
67 |
|
11 |
pZE21/HindIII+KpnI |
28 |
5.5 |
154 |
|
12 |
pZE21/HindIII |
6.8 |
16.7 |
113.56 |
|
13 |
pZE21/KpnI |
6.8 |
16.7 |
113.56 |
Table 1: DNA
samples loaded on the gel and their concentration and the amount of
samples loaded
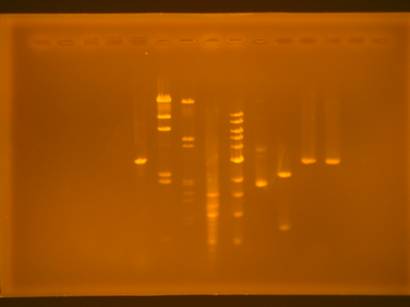 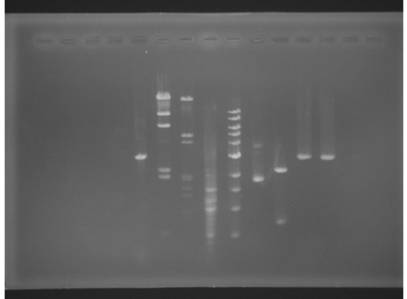
Figure 1: RGB
image of the gel (top) and gray image of the gel (bottom)
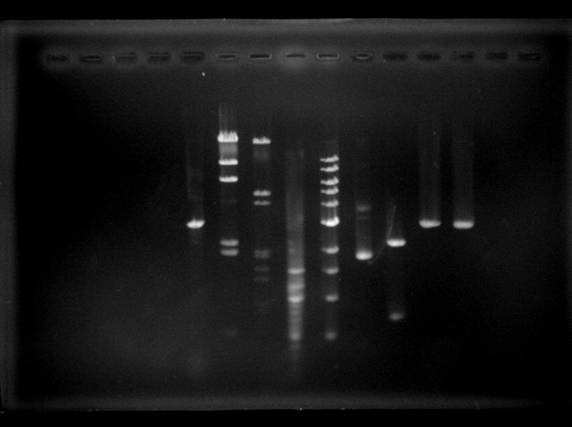
Figure 2: Image
processing with MATLAB helps to identify each band more clearly.
The number of bands in each lane represented the number of DNA fragments
generated by each treatment. By comparing the distance of each
fragment migrated to the relative location of 1 Kb ladder in the gel,
the approximate molecular size of each fragment was estimated.
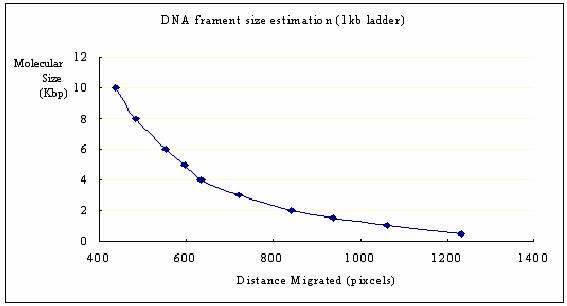
Figure 3: The
relationship between the molecular size and the distance migrated in the
gel
|
|
# of DNA fragments per λ-phase, E-coli, or
pZE21 DNA |
Size of each fragment (Kbp) |
|
PCR product of E-Coli |
N/A |
|
|
PCR product of plasmid |
1 |
2.8 |
|
λ-phase/HindIII |
6 |
12.9, 7.9, 5.9, 2.0, 1.8, 0.6 |
|
λ-phase/HindIII + EcoRI |
~7 |
11.1, 4.7, 4.0, 1.8, 1.7, 1.4, 1.1 |
|
Uncut Vector |
1 |
1.7 |
|
pZE21/HindIII+KpnI |
2 |
2.2, 0.7 |
|
pZE21/HindIII |
1 |
2.9 |
|
pZE21/KpnI |
1 |
2.9 |
Table 2: The
estimated number of DNA fragment per λ-phase, E-Coli, or pZE21 as a
result of restriction digest or PCR from by the gel electrophoresis
analysis
For restriction digest of pZE21-GFP, the amount of DNA for each kind of
fragment and the yield of the digestion was determined by comparing the
sample DNA intensity to that of a DNA quantization standard (1Kbp
ladder).
 Figure
4: 0.5 µg of 1 kb DNA Ladder visualized by ethidium bromide staining on
a 0.8% TAE agarose gel (courtesy NEB)[1] Figure
4: 0.5 µg of 1 kb DNA Ladder visualized by ethidium bromide staining on
a 0.8% TAE agarose gel (courtesy NEB)[1]
|
|
The amount of DNA (ng) |
Yield (%) |
|
pZE21/HindIII+KpnI |
63 (longer fragment), 80 (shorter) |
93 |
|
pZE21/HindIII |
135 |
104 |
|
pZE21/KpnI |
142 |
110 |
Table 3: The
amount of DNA for each fragment resulted from restriction digest of
pZE21-GFP and yield (* yield = ) )
Discussion
By using Vector NTI program (Invitrogen), the actual number of the
fragments of their size for each digestion were obtained. Then they
were compared to those we estimated from the gel analysis.
Figure 5:
HindIII sites for λ-phase
Figure 6:
HindIII and EcoRI sites for λ-phase
Figure 7: HindIII site for pZE21-GFP
Figure 8: KpnI site for
pZE21-GFP
Figure 9: KpnI and HindIII sites for pZE21-GFP
|
|
# of DNA fragments per λ-phase, E-coli, or
pZE21 DNA |
Size of each fragment (Kbp) |
|
λ-phase/HindIII |
6 |
27.5, 9.4, 6.7, 2.3, 2.0, 0.6 |
|
λ-phase/HindIII + EcoRI |
10 |
5.1, 4.9, 4.2, 2.0, 1.9, 1.7, 1.4, 0.9, 0.8, 0.6 |
|
Uncut Vector |
1 |
Circular |
|
pZE21/HindIII+KpnI |
2 |
2.2, 0.7 |
|
pZE21/HindIII |
1 |
2.9 |
|
pZE21/KpnI |
1 |
2.9 |
Table 2: The
actual number of DNA fragment per λ-phase, E-Coli, or pZE21 as a result
of restriction digest or PCR
Figure 10: The
comparison between the actual and estimated length of each fragments for
HindIII treated λ-phase DNA
The length of fragments from HindIII treated λ-phase DNA was
fairly well estimated by the analysis of the gel electrophoresis.
Only for the longest fragment, the estimation significantly failed.
However, when it was digested additionally with EcoRI, the result from
the gel electrophoresis was not instructive as we had too many bends and
a couple of them were too vague to identify. As a result, the
number of fragments were actually underestimated for this sample.
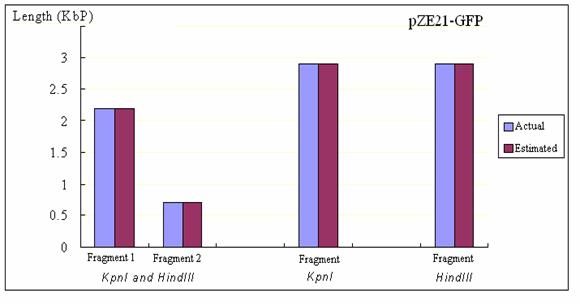 Figure
10: The comparison between the actual and estimated length of each
fragments for restriction enzyme treated pZE21-GFP Figure
10: The comparison between the actual and estimated length of each
fragments for restriction enzyme treated pZE21-GFP
On the other hand,
in case of pZE21, the gel results gave the perfect estimation for both
number of fragments and the size of each fragment. In addition, it
was interesting to observe that circular DNA (uncut pZE21) and the
linear DNA fragment (either of KpnI or HindIII treated
pZE21) moved with different speed even though they have the same length.
The yield of the
restriction digest was also estimated (Table 3). Since the optimal
reaction buffer cannot be used for the double digest, it did not yield
as much digested DNA as the single digest did. However, the yield
estimation through the pixel analysis of the gel image was quite
erroneous. For example, in our analysis, the yield for the single
digest was higher than 100%.
Gel electrophoresis
indeed was a powerful tool to separate DNA molecules based on the
physical characteristics such as size and shape. We also have seen
that some of the quantitative analysis, especially in estimating the
size of fragments and the yield of restriction digest, can be done by
using the digital image of the gel. However, at the same time, gel
electrophoresis had relatively low quantitative accuracy and limited
dynamic range.
References
1.
Biolabs, N. E. Restriction Endonuclease.
http://www.neb.com/nebecomm/default.asp?
© 2003 PhryxusWebdesign, All Rights Reserved.
|