DNA SCIENCE
WEEK 3
Objectives:
Gene regulation at a single cell
level
Introduction:
The study of
genetic switches is based on the quantitative relationship between
transcription factor concentrations and the rate of protein production
from downstream genes. This relationship can be explored using
fluorescent reporter genes and quantified using image analysis of
fluorescent microscopy.
Methods:
The following
genetic switch was established by transforming the lacI, tetR, and araC
genes into MC4100Z1
strain of E. Coli, as described in Week 2 to
produce a genetic switch. In particular, we are interested in the
simple transcription unit where the PLtetO-1 promoter (which
constrains a tightly regulated TetR repressor) is fused to cI-gfp
gene such that GFP is induced by the presence of
anhydrotetracycline (aTc) as shown in Figure 1a.
a.
b.
Figure
1a. Synthetic transcription circuit: a.) Simple transcription unit (open
loop, MC4100 + pZS12-tetR + pZE21-gfp). Cells expressing TetR can be
induced, by adding aTc to the medium, to produce GFP (from
Rosenfeld et al. JMB 2002). b.) Topography and sequence of
promoter region (from
Lutz et al. NCR 1997).
MC4100Z1 cells were
grown at different concentrations of aTc (1-50 mg/mL) in order to
characterize inducible expression. Cells of MC4100Z1 and pZE21-LacI were
obtained as negative controls and to provide a measurement of
auto-fluorescence. In addition, MC4100 was also transformed with
pZE21-GFP where all cells will express GFP as a positive control.
List of Slides:
-
MC4100,
pZE21-GFP
-
MC4100Z1
-
MC4100Z1_pZE21-LacI
-
MC4100Z+No ATC
-
MC4100Z+1 mg/mL
ATC
-
MC4100Z+5 mg/mL
ATC
-
MC4100Z+10 mg/mL
ATC
-
MC4100Z+50 mg/mL
ATC
In order to be
viewed at 100x resolution, special preparation must be made of the
slides. Slides were prepared by placing a 22x50mm coverslip over a
base and adding 2.5 uL of 2% molten agarose gel and then gently placing
another coverslip over it. The second coverslip should be exactly
parallel to the coverslip underneath. Rotate the base if necessary
to adjust the plane of the gel. Let the gel harden for 5-10
minutes then slip off the top coverslip. Cut an approximately
15x15mm portion of the gel and place it onto a slide. Pipette
cells onto the gel and place a coverslip over it.
Slides were
examined at 100x phase using both brightfield and fluorescence under a
Zeiss Axio microscope.
AxioVision 4.4 software was used to automate brightfield and fluorescent
data acquisition to avoid differences in the two subsequent images.
Exposure time was optimized for each sample and 10 images were taken of
different locations throughout each slide in order to produce an
accurate representation of the E. coli cell population.
Photobleaching was
measured by acquiring time-lapse frames 500ms apart for 60 frames.
Images were
analyzed using a custom software using MATLAB (Mathworks,
Inc.). Analysis proceeded in several stages: Cells were
identified in the brightfield image using an edge detection algorithm.
Each detected area was labeled and identified as an individual cell and
counted. In the fluorescent image, exposure time was accounted for
by an intensity transformation that increasing the sensitivity of
lower-value pixels. Background and cellular auto-fluorescence was
subtracted from the channel by setting a lower limit boundary to the
threshold. After image reprocessing, cells were identified using
and edge-detection algorithm, labeled, identified, and counted.
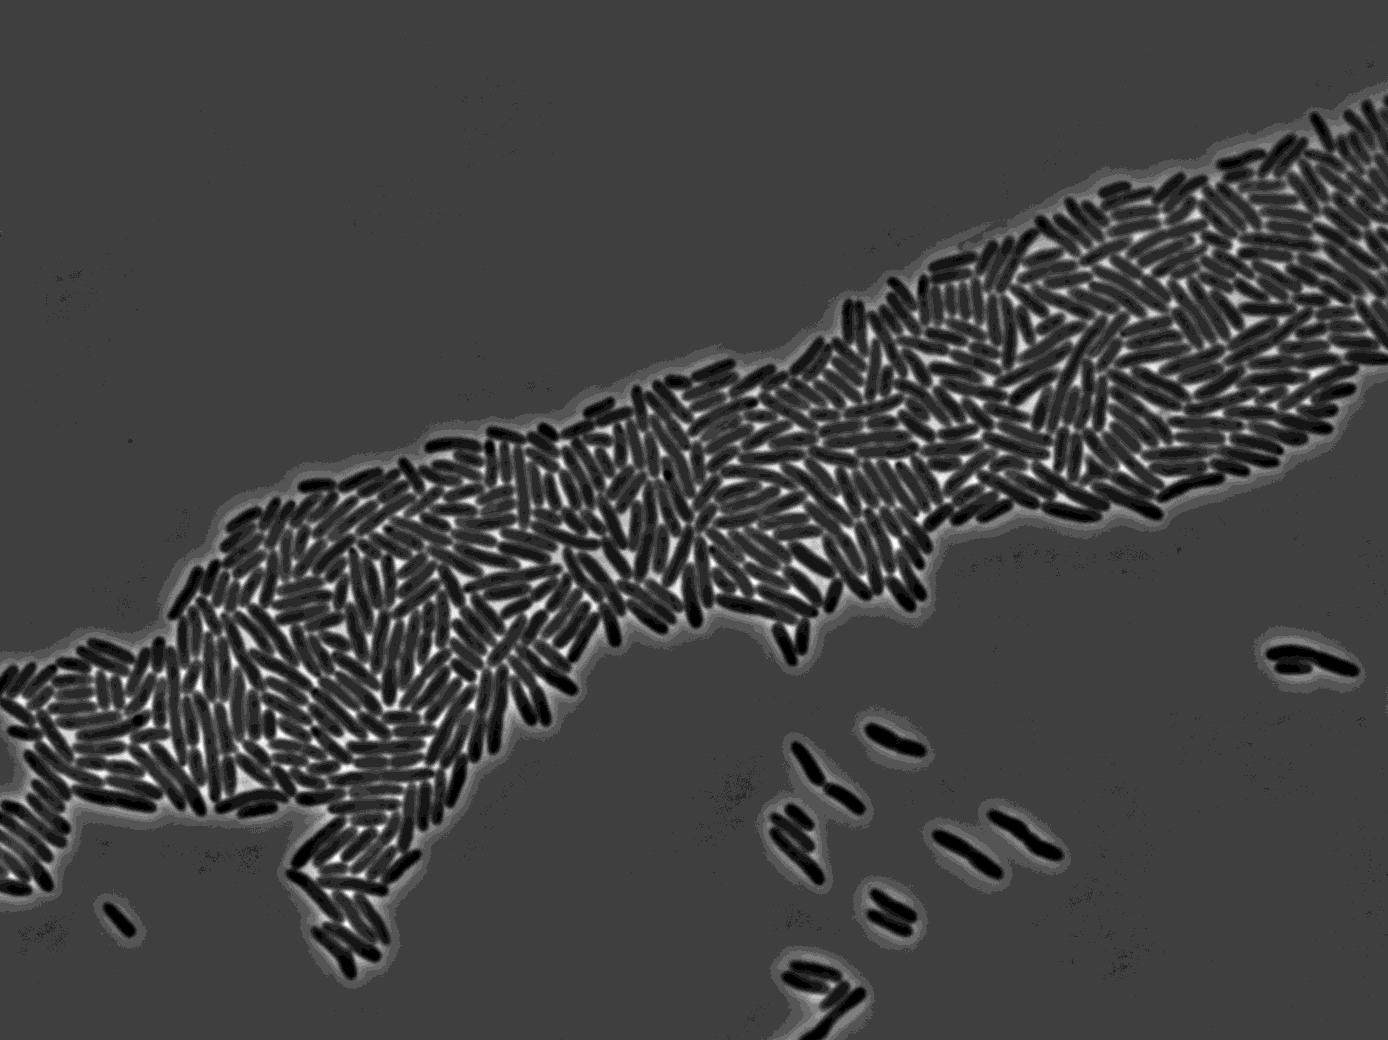
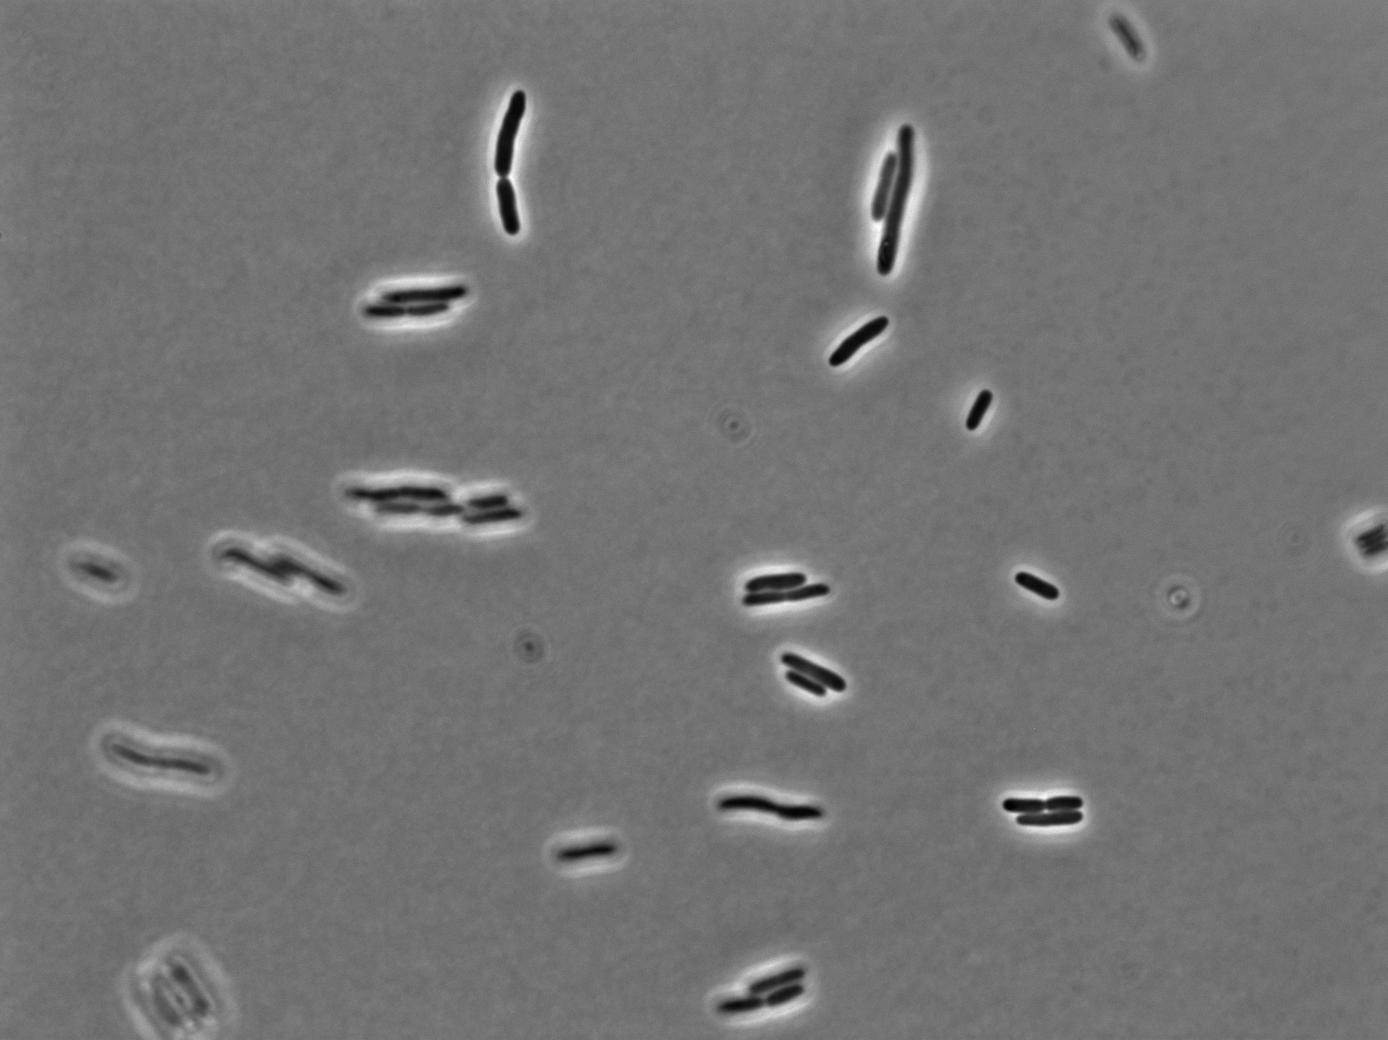
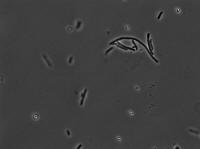
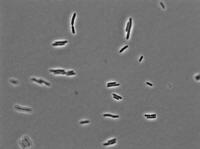
Results:
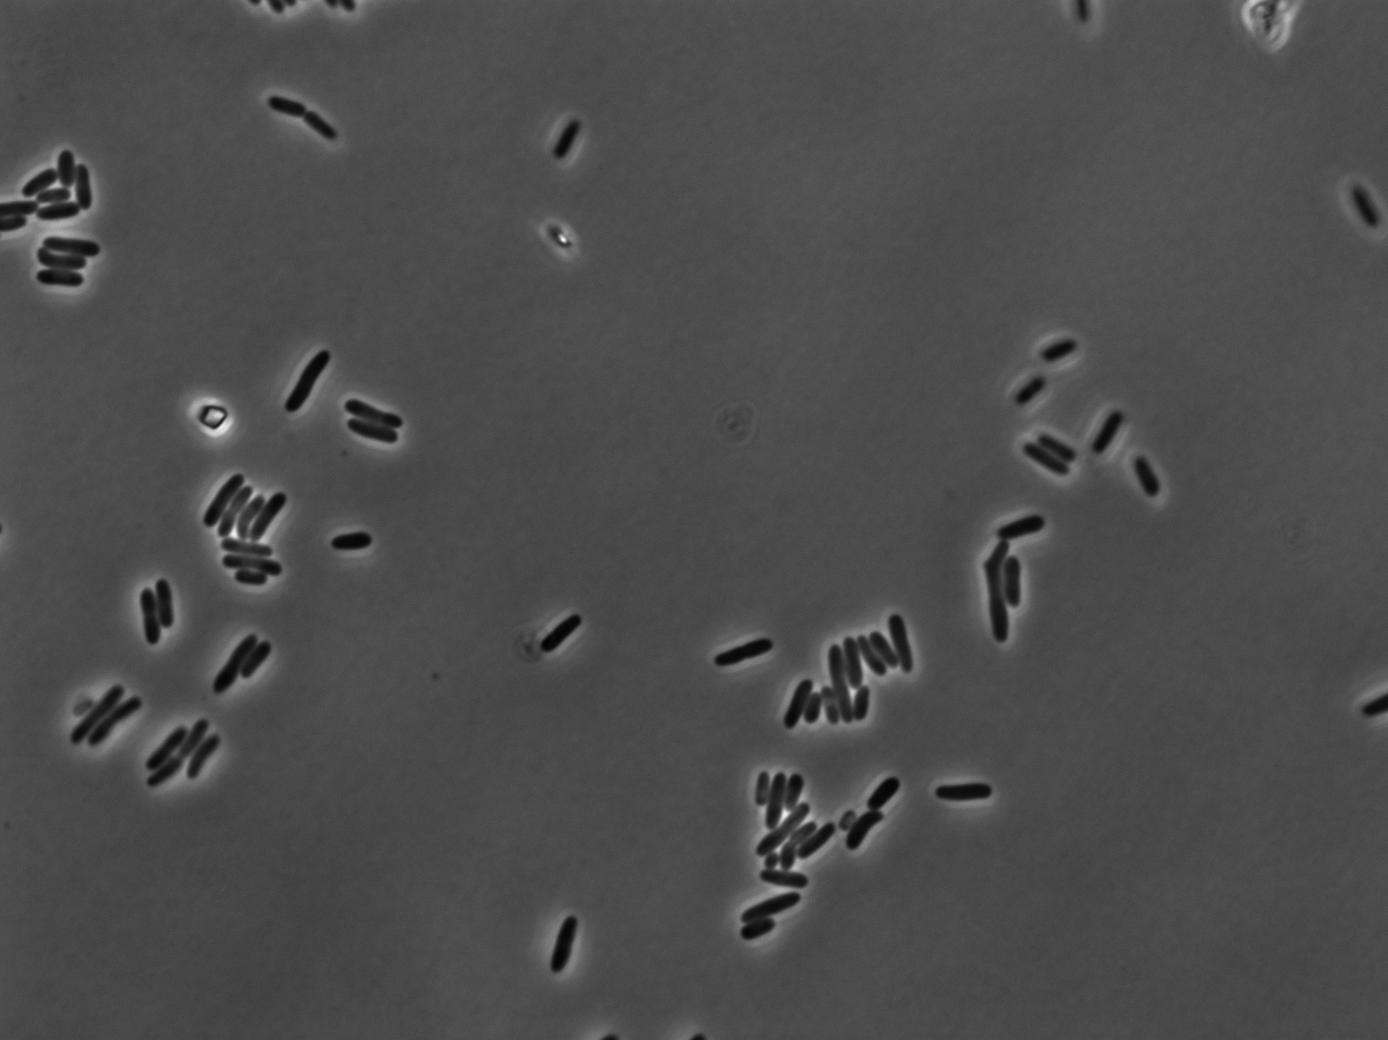
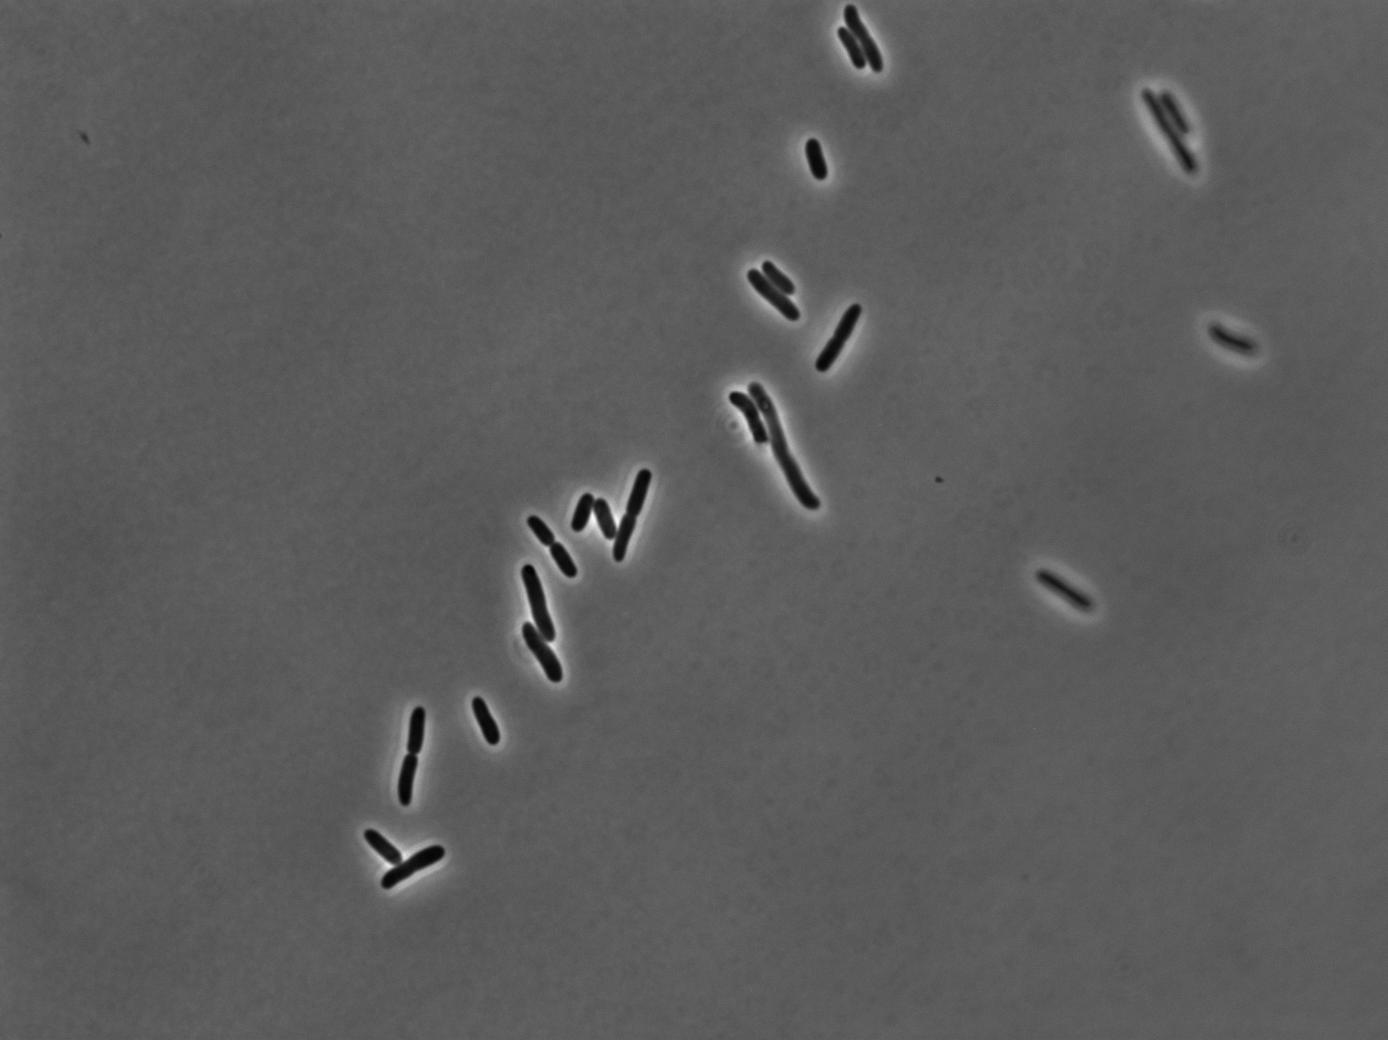
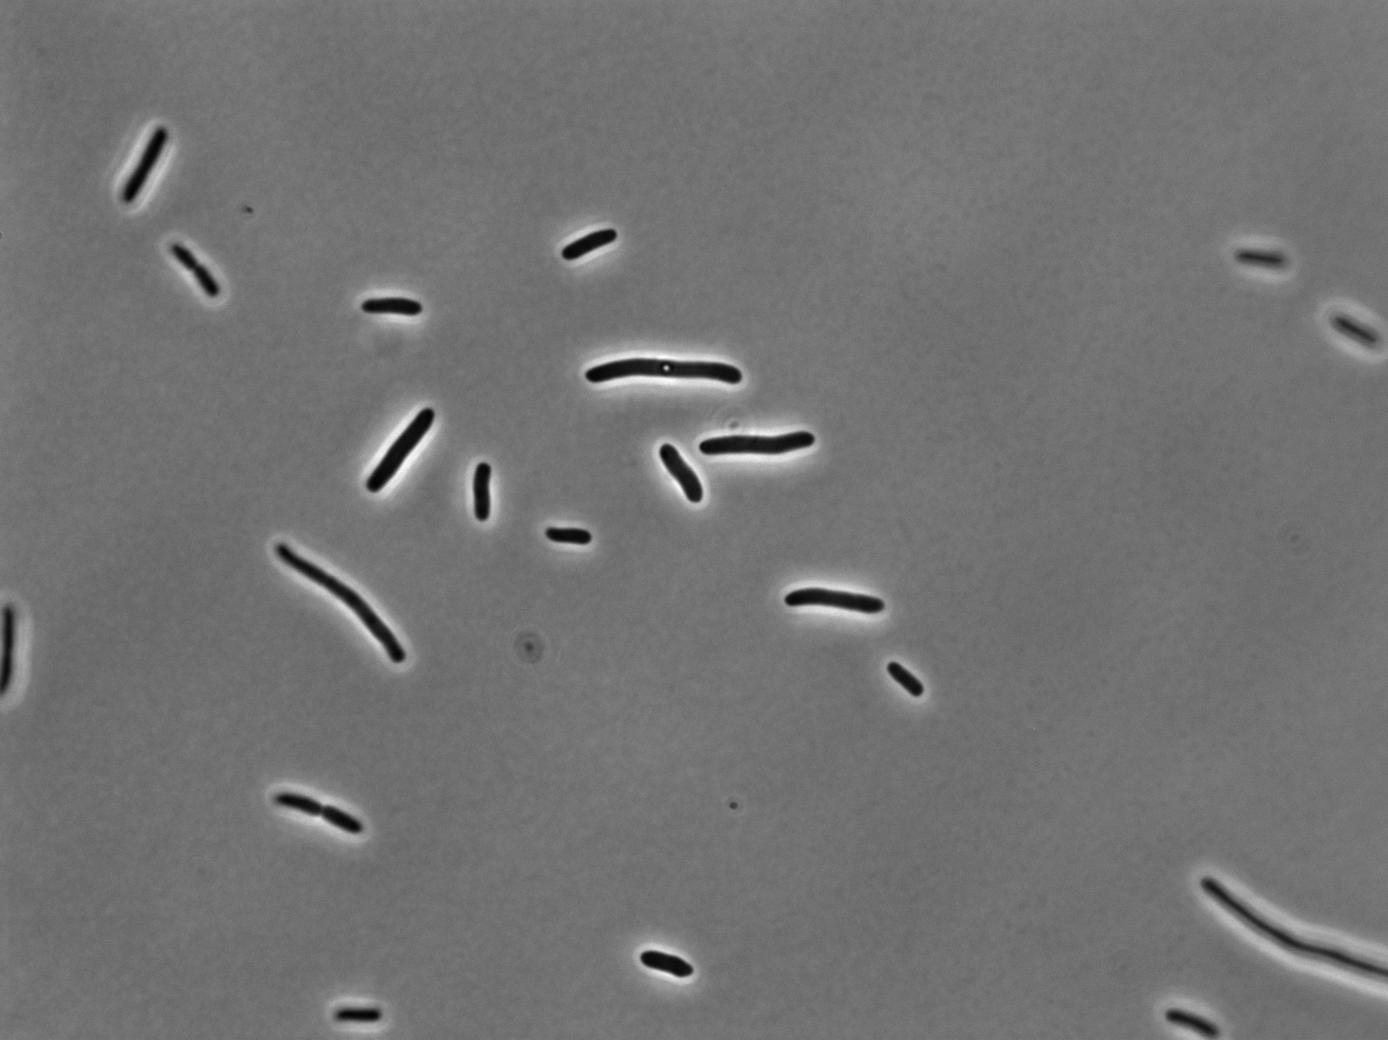
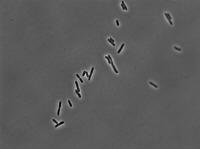
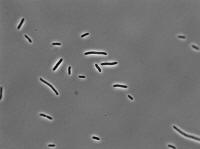
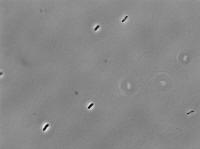
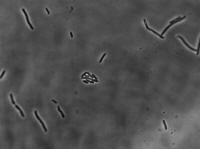
Representative
images from each slide:
MC4100-pZE21-GFP:


MC4100Z1:

MC4100Z1-pZE21-LacI:

0 mg/mL aTc:

1 mg/mL aTc:

5 mg/mL aTc:

10 mg/mL aTc:

50 mg/mL aTc:

Fold Change = GFPATC=50
– GFPautof / GFPATC=0 – GFPautof
= 72.66 - 0.53 / 0.85 - 0.59 = 277.43
Unfortunately
photobleaching calculations could not be made because focus drift
occurred over the time period of the data acquistion such that blurring
of the images occurred faster than the photobleaching effect.
Conclusion:
In the overall experiment, we
would extract the lacZ gene from wild type E. Coli (MG1655, GenBank
U00096), insert it into a pZE21-GFP vector with kanamycin
resistance, and finally transform the E. Coli cell so that it can
express lacZ upon the induction of tetracycline promoter. As the
first series of this experiment, cloning vectors were obtained by
double digesting pZE21-GFP with KpnI and HindIII. lacZ gene from
wild type E.Coli (MG1655) was then amplified using PCR. The results
were analyzed via gel eletrophoresis.
The blue color showed in petri
dish containing X-gal indicated the presence of B-gal. Our desired
DNA insert has been successfully incorporated and expressed.
Although
steady-state was not achieved, it could be concluded that the the
kinetics of the simple transcription unit follows Michealis-Menton
induction rates.