Introduction:
Lytechnius variegates (sea urchin) is one of the model
organisms in development biology. It gives main advantages in
investigating the earliest steps of development since there are
essentially no limitations on material for large scale RNA
purification and for isolation of native proteins in sufficiently
large amounts to carry out functional and biochemical analyses on
the protein level [1]. Furthermore, it has optically clear, easily
manipulated embryo that is resistant to considerable
micromanipulation [2]. The small number of genes, approximately
27,000 and the relatively simple structure of the primary larva
offers an ideal model for detailed analyses of developmental
processes [3].
Aims:
In this lab, the fertilization and early development of sea urchin
embryo will be visualized. Then the time frame of those processes
and the change of embryo morphology will be quantitatively analyzed,
Material and Methods:
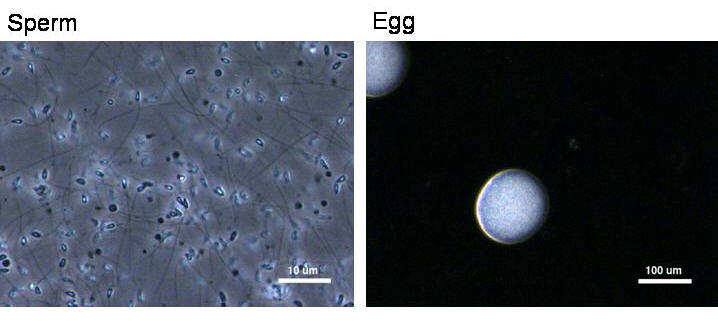
We first harvested eggs and sperm from sea urchins by injecting 0.5M
KCl para-orally. Eggs were collected by inverting female urchins
over 100 mL beakers with artificial sea water. Sperms were collected
by inverting male urchins on 10 mm petri dishes. A drop of egg
suspension was placed on a glass depression slide under a microsope
and covered by a cover slip. Sperms were diluted by a factor of 10
to prevent polyspermic events. Then a small drop of sperm suspension
was added, allowing fertilization and embryo development. The time
lapse images were taken by Nikon microscope at 10X with the rate of
30 seconds per frame. The images were then quantitatively analyzed
by ImageJ.
Results:
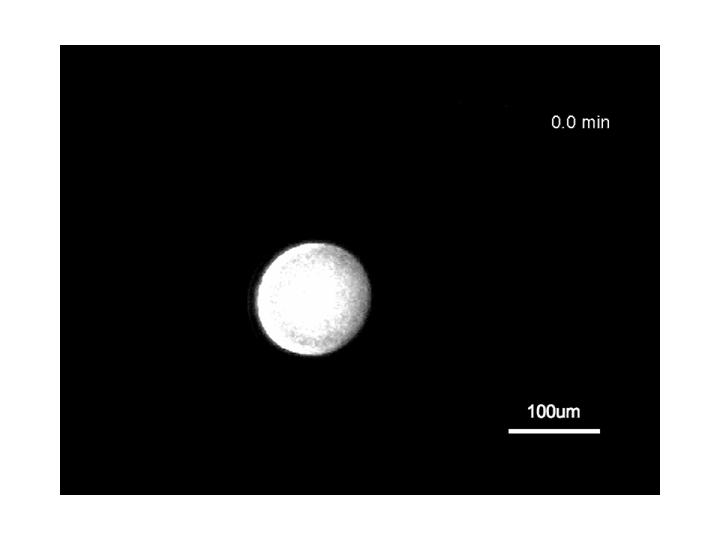
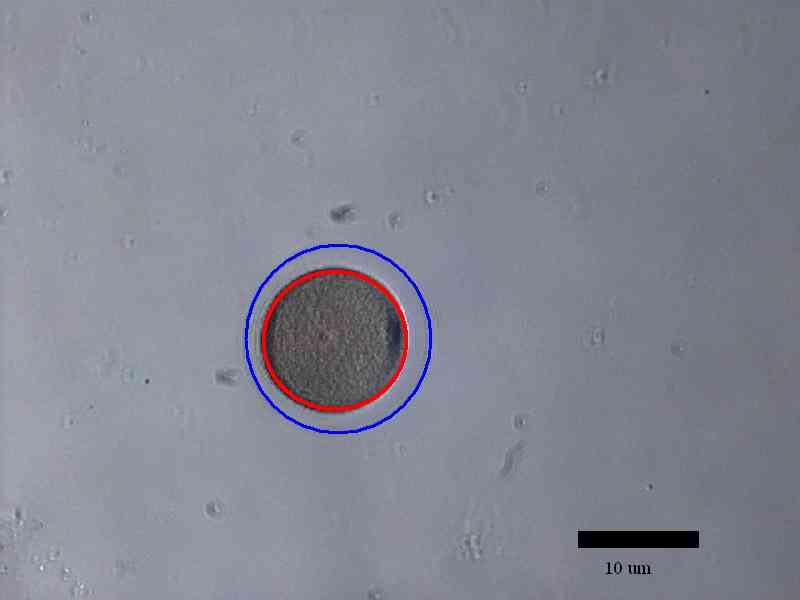
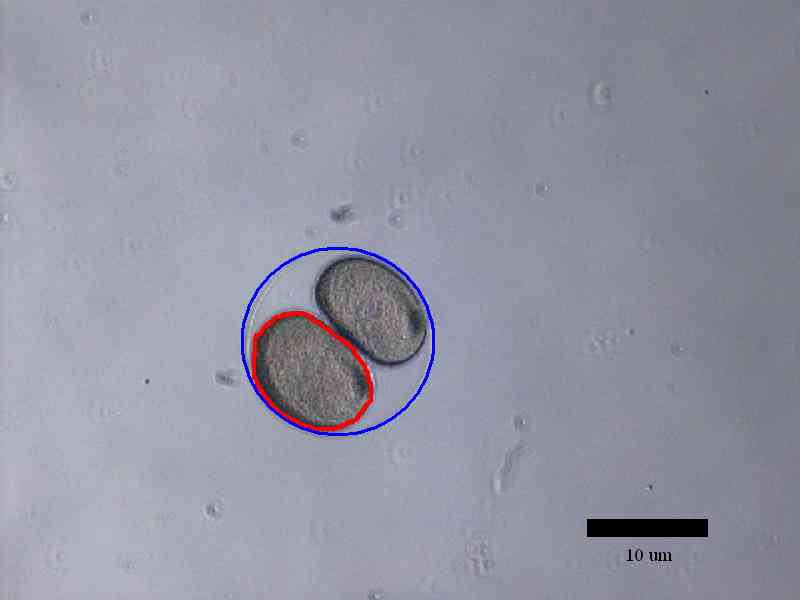
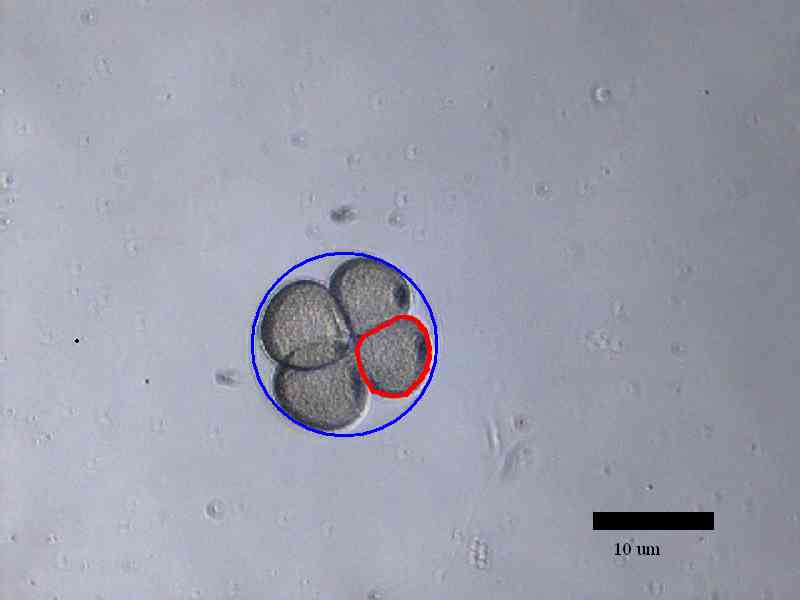
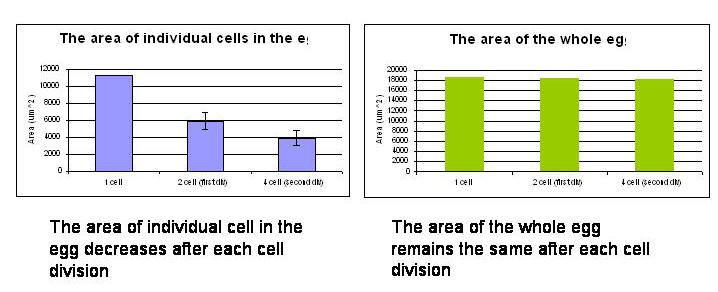
The development of sea urchin embryos were observed until the second
division finished. The area of individual cell in the egg decreased
after each cell division while the area of the whole egg remained
the same after each cell division. Time for the process of each
division was roughly 6 minutes and time between cell divisions was
22 minutes.
Click on image below for
movie (3MB):
Examples of how cell volume was measured using ImageJ:
Conclusion:
The efficiency of the fertilization process was low, mostly because
of inappropriate egg and sperm dilution. At too low sperm
concentration, only a few fractions of eggs were fertilized. On the
other hand, high sperm concentration resulted in polyspermy and
abnormal development of the embryos. Thus it would be beneficial to
find an optimal concentration of eggs and sperms to bring more eggs
into fertilization. Also, as we were not able to maintain
appropriate salt concentration for sea urchin embryos due to
evaporation of artificial sea water from the sample, they died after
second division, thus could not reach the blastula stage. Thus next
time, eggs will be fertilized and developed in a separate beaker and
a sample for observation would be attained from it every two hours
during the development process. In a future study, immunostaining
technique would be used for fluorescence visualization of
chromosomes and nuclei of sea urchin embryos.
References:
1. Epel, D., Vacquier, V. D., Peeler, M., Miller, P. and Patton,
C. (2004). Sea urchin gametes in the teaching laboratory: good
experiments and good experiences. Methods Cell Biol 74, 797-823.
2. Levine, M. and Davidson, E. H. (2005). Gene regulatory networks
for development. Proc Natl Acad Sci U S A 102, 4936-42.
3. Oliveri, P. and Davidson, E. H. (2004). Gene regulatory network
analysis in sea urchin embryos. Methods Cell Biol 74, 775-94.
|