|
Introduction:
The enzyme β-galactosidase (β-gal) plays an
important role in cellular metabolism by breaking down lactose into
glucose and galactose (Figure
1), important fuels for the cells. In E. Coli the
lacZ gene produces β-gal and is often used as a marker
for gene expression. In this study, we will be measuring enzyme
kinetics of β-gal indirectly using a lactose analog, o-nitrophenyl-β-galactopyranoside
(ONPG) which is cleaved by β-gal to o-nitrophenyl-(ONP) which
has a different absorbance and can observed by eye. Quantitation is
achieved using a spectral photometer. Enzyme kinetics will be
calculated using the following equation:
Aims:
1. Verify experimentally if β-Galactosidase kinetics are linear
2. Determine rate constants and conversion of ONPG to ONP by β-Gal
3. Determine molar extinction coefficient for ONP experimentally
Methods:
1. Calculate molar extinction constant from
Fowler & Zabin (PNAS 1977):
# of AA in β-galactosidase
Extinction coefficient @ 280 (mol/cm)
38 tryptophan
5690
31 tyrosines
1280
16 cystines (half-cystines) 120
From equation 1
in
Gill & von Hippel (Analy Biochem, 1989):
Extinction
coefficient = 4x[38(5690) + 31(2180) + 16(120)]M-1cm-1

2. Dilute ONPG and β-Galactosidase
in phosphate buffer and Z buffer, respectively:
Phosphate buffer:
1.61g Na2HPO4-7H2O, 0.55g NaH2PO4-H2O
in 100mL DD-H2O and adjust pH to 7.0
Z-buffer: 0.8g Na2HPO4-7H2O,
0.28g NaH2PO4-H2O, 0.5mL of 1M KCl,
0.05ml of 1M MgSO4,
0.135ml β-mercaptoethanol, adjust pH to 7.0 and store at
4C.
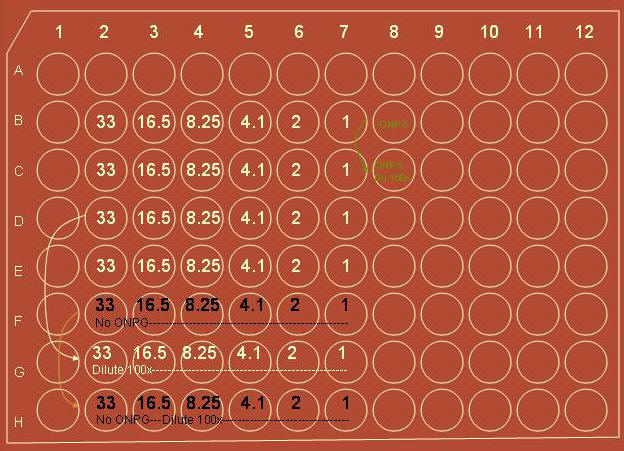
In order to plot the
linear kinetics, we diluted β-gal at 6 different
concentrations. To do this over multiple trials,
troughs were filled according to the table below:
Well Row
Conc(units/ml) Measurement
D1 33 84 ul of 330
u/ml beta-gal
756 ul of z-buffer
D2
16.5 42 ul of beta
798 ul
of z
D3
8.25 21 ul of beta
819 ul
of z
D4
4.125 10.5 ul of beta
829.5 ul
of z
D5
2.1 5.25 ul of beta
835 ul
of z
D6
1 2.63 ul of beta
837 ul
of z
210 ul of 4 mg/ml
phosphate buffer + ONPG per trough
Using a multichannel pipette, rows B-F of the of the plate is filled
according to the diagram below:
Rows B-F were filled
with 140 ml from each trough
B-E were then filled
with 35ml of ONPG+phosphate buffer
F was filled with
just 35 ml of buffer, no ONPG to serve as a control
B8 was filled with
140 ml of z-buffer and 35 ml of ONPG.
3. MeasureOD at 420nm using an automated plate
reader, data was acquired every 15 seconds for 60 minutes.
4. An addition dilution at 100x was acquired:
1)
175/7 = 25 ul out of each well in row D and placed into row G
2)
Added 150 ul of buffer to each well in row G to dilute by
100x
3)
Took 25 ul out of each well in row E to row H
4)
In row H added 150 ul of buffer to each well to dilute
controls by 100x
5)
Took 25 ul out of B8 and added it to C8
6)
Added 150 ul of buffer to dilute negative control by 100x
7)
Ran in spectrophotometer at 300 nm to 800 nm in 2 nm steps
5. In order to quantify β-galactosidase,
we must denature the protein and obtain a proper measurement of the
residues:
1)
Take 18 ul of β-galactosidase in eppedorf and placed it in
D8
2)
Added 162 ul of Gaunidinium HCl to dilute it by 10x
3)
Added 150 ul of Gaunidinium HCl and 25 ul of z-bufer in F8 as
a control
4)
Acquired data in spectrophotometer at fixed wavelength of
280nm
5)
Absorption measured in D8 = 1.6061, F8 = 1.4758
6)
Measured well size = 6.6 mm=0.66cm
7)
ONPG concentration:

6. Using calipers, the well
heigh was measured, this is necessary for the following ONP
extinction coefficient calculations:


Results:
The OD measurements
for wells B-F are shown below:
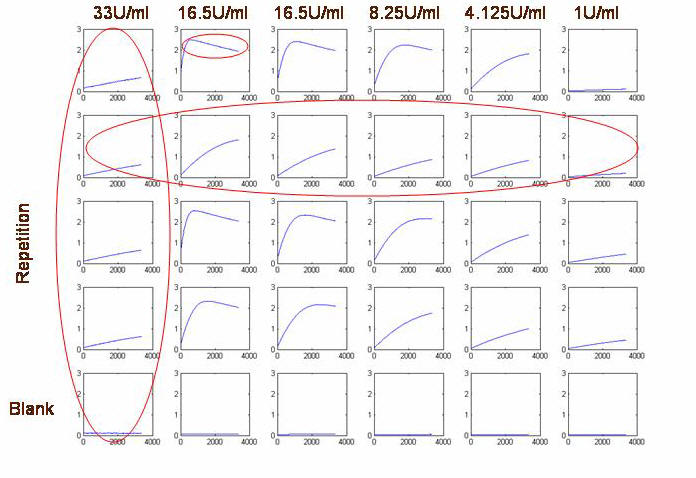
As seen in kinetic
reaction plot, there is degradation in ONP corresponding to
approximately 0.4 OD units. Since this degradation is in the
non-linear absorbance regime, we cannot extrapolate a constant to
add. This experiment can be performed again with the same enzyme and
substrate concentration, and stopped before degradation occurs,
since we now know the timescale.
Error estimate: there
may be deviations in the height of the well due to pippeting errors.
:
Solving for K+:
After solving the
differential equations we get the term:
The literature figure
for  =3500 =3500 .[1] .[1]
The Literature states that Kcat =
480 [2].
As we can see, the only set of parameters fitting the literature are
the averages of the small slopes and the literature cited extinction
coefficient.
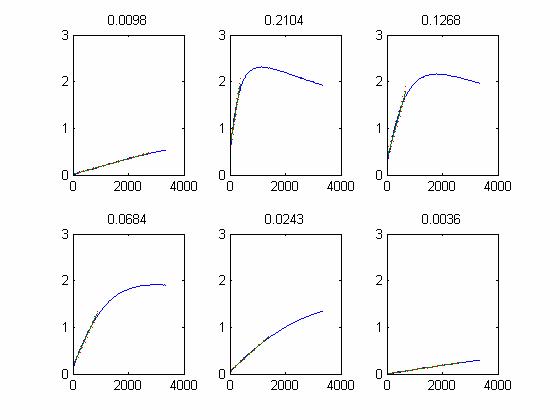
Slopes for the graphs starting with 33u/ml(left)
ending with 1 u/ml(right):
0.0098 0.2104 0.1268 0.0684
0.0243 0.0036
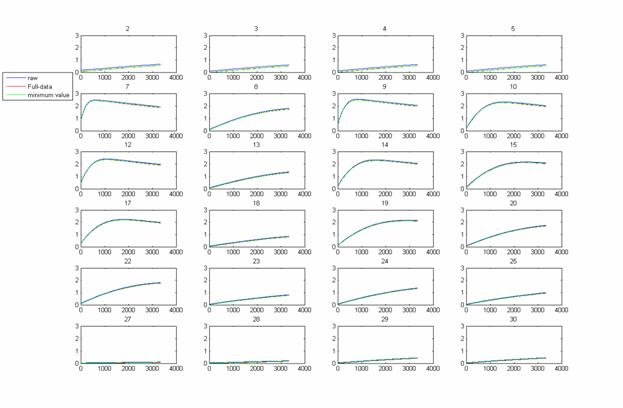
After modeling differential equations:
Slope: 0.5853 0.6243 0.5482 0.3795
0.2349 0.1251
|